🚀 Key Advantages of 5-Year Analysis
- Long-term Trends: Identify major market cycles and secular trends
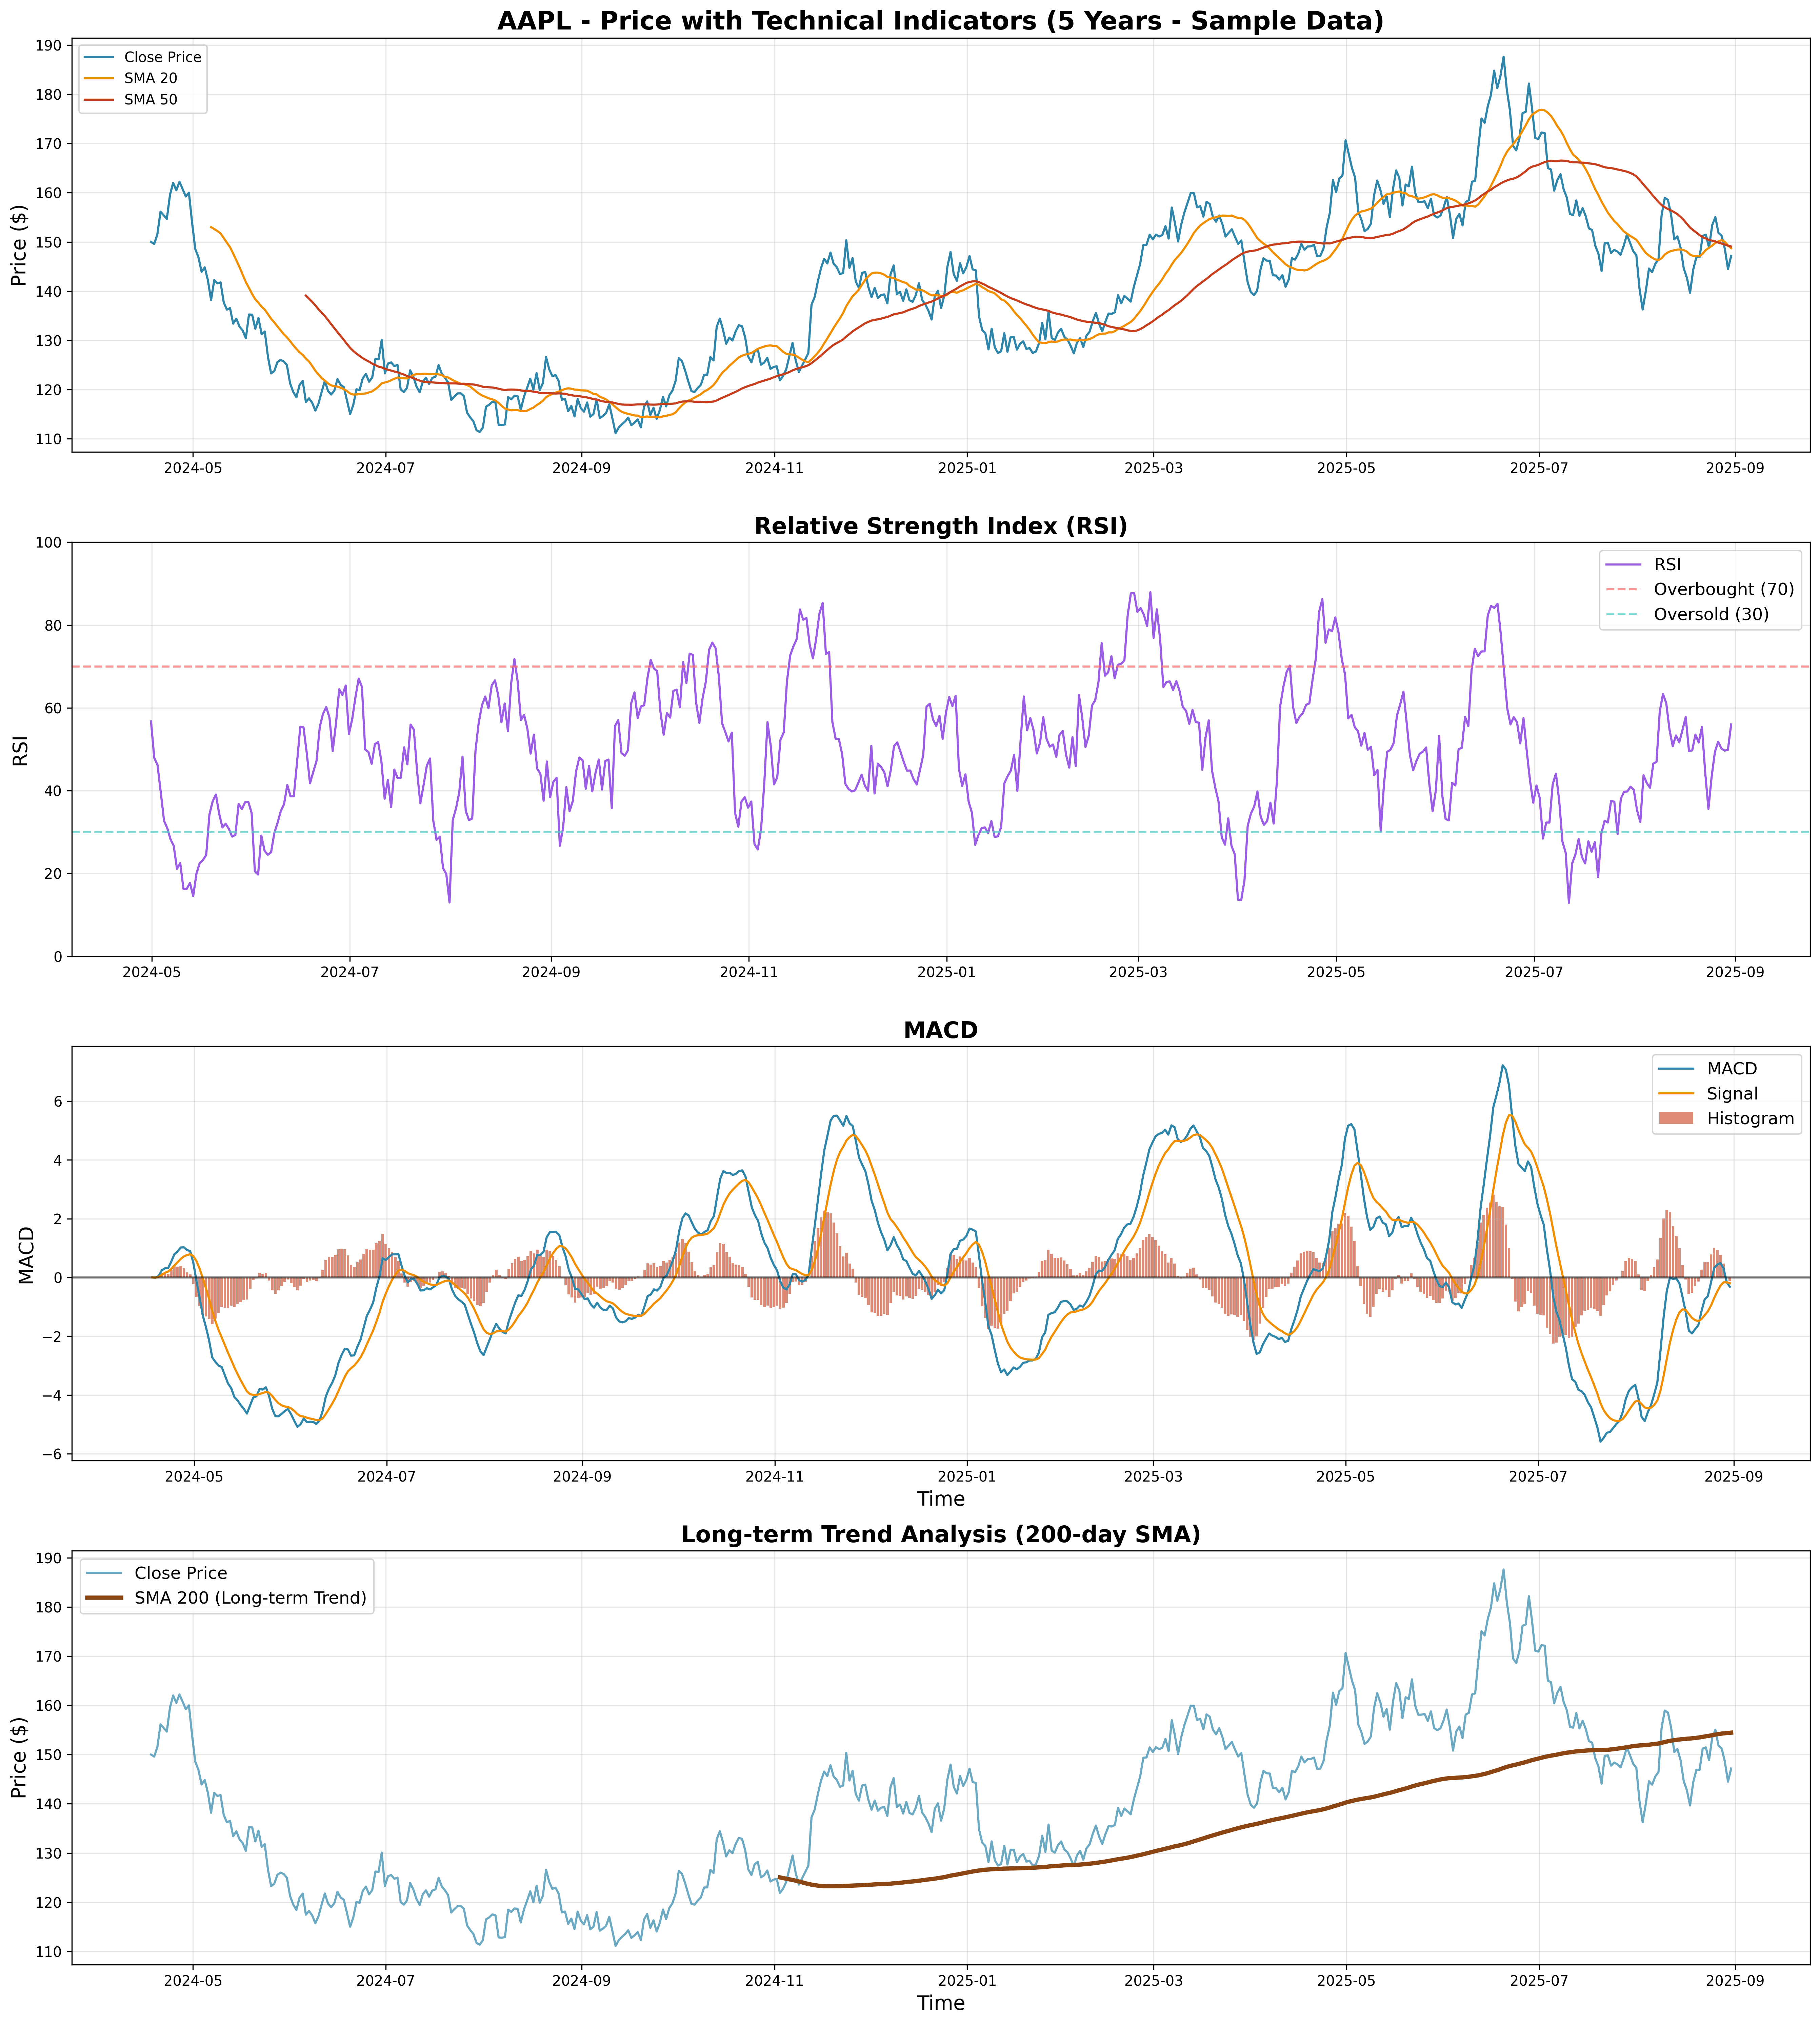
- 200-day SMA: Industry standard for long-term trend analysis
- Golden/Death Cross: Spot major trend reversals with 50/200 SMA crossovers
- Market Cycles: See complete bull/bear market cycles
- Volatility Patterns: Understand long-term volatility characteristics
🎯 What This 5-Year Report Shows
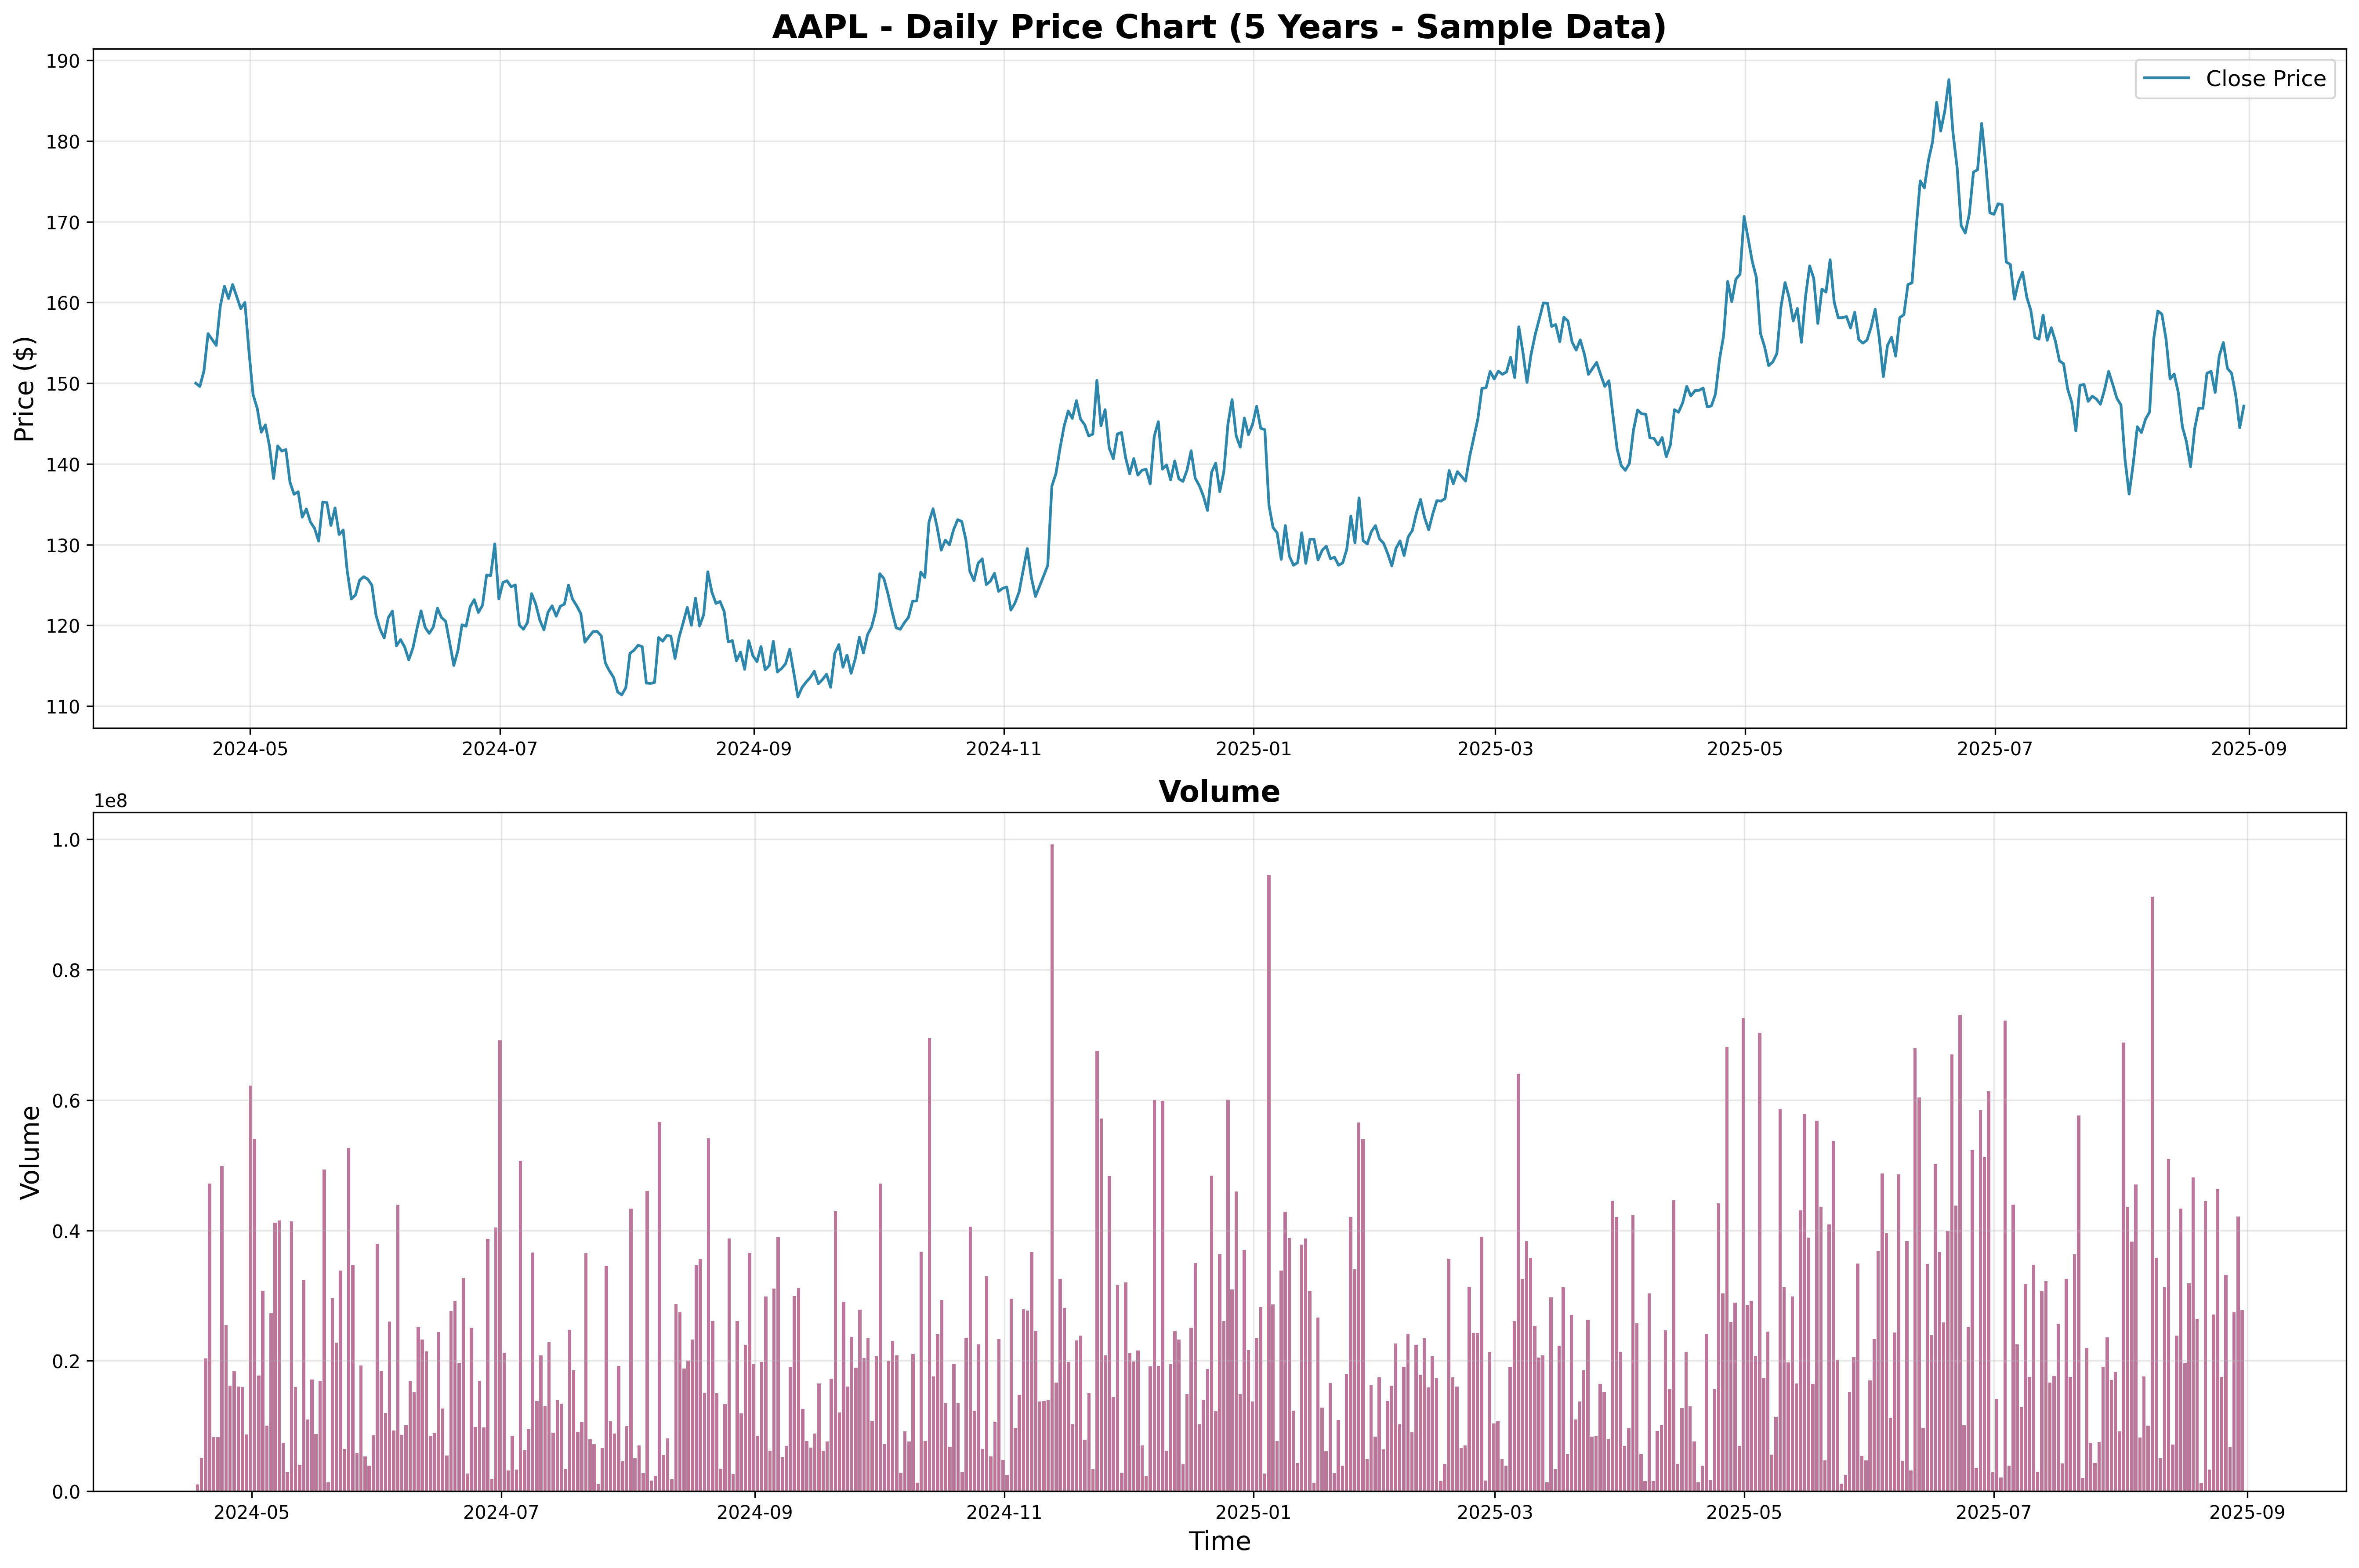
- Extended Price History: 5 years of daily price movements with volume analysis
- Advanced Technical Indicators: 20+ professional indicators including 200-day SMA, 50-day EMA
- Long-term Trend Analysis: Moving averages for different time horizons (20, 50, 200 days)
- Market Cycle Analysis: Identify bull markets, bear markets, and consolidation periods
- Golden/Death Cross Detection: Major trend reversal signals using 50/200 SMA crossovers
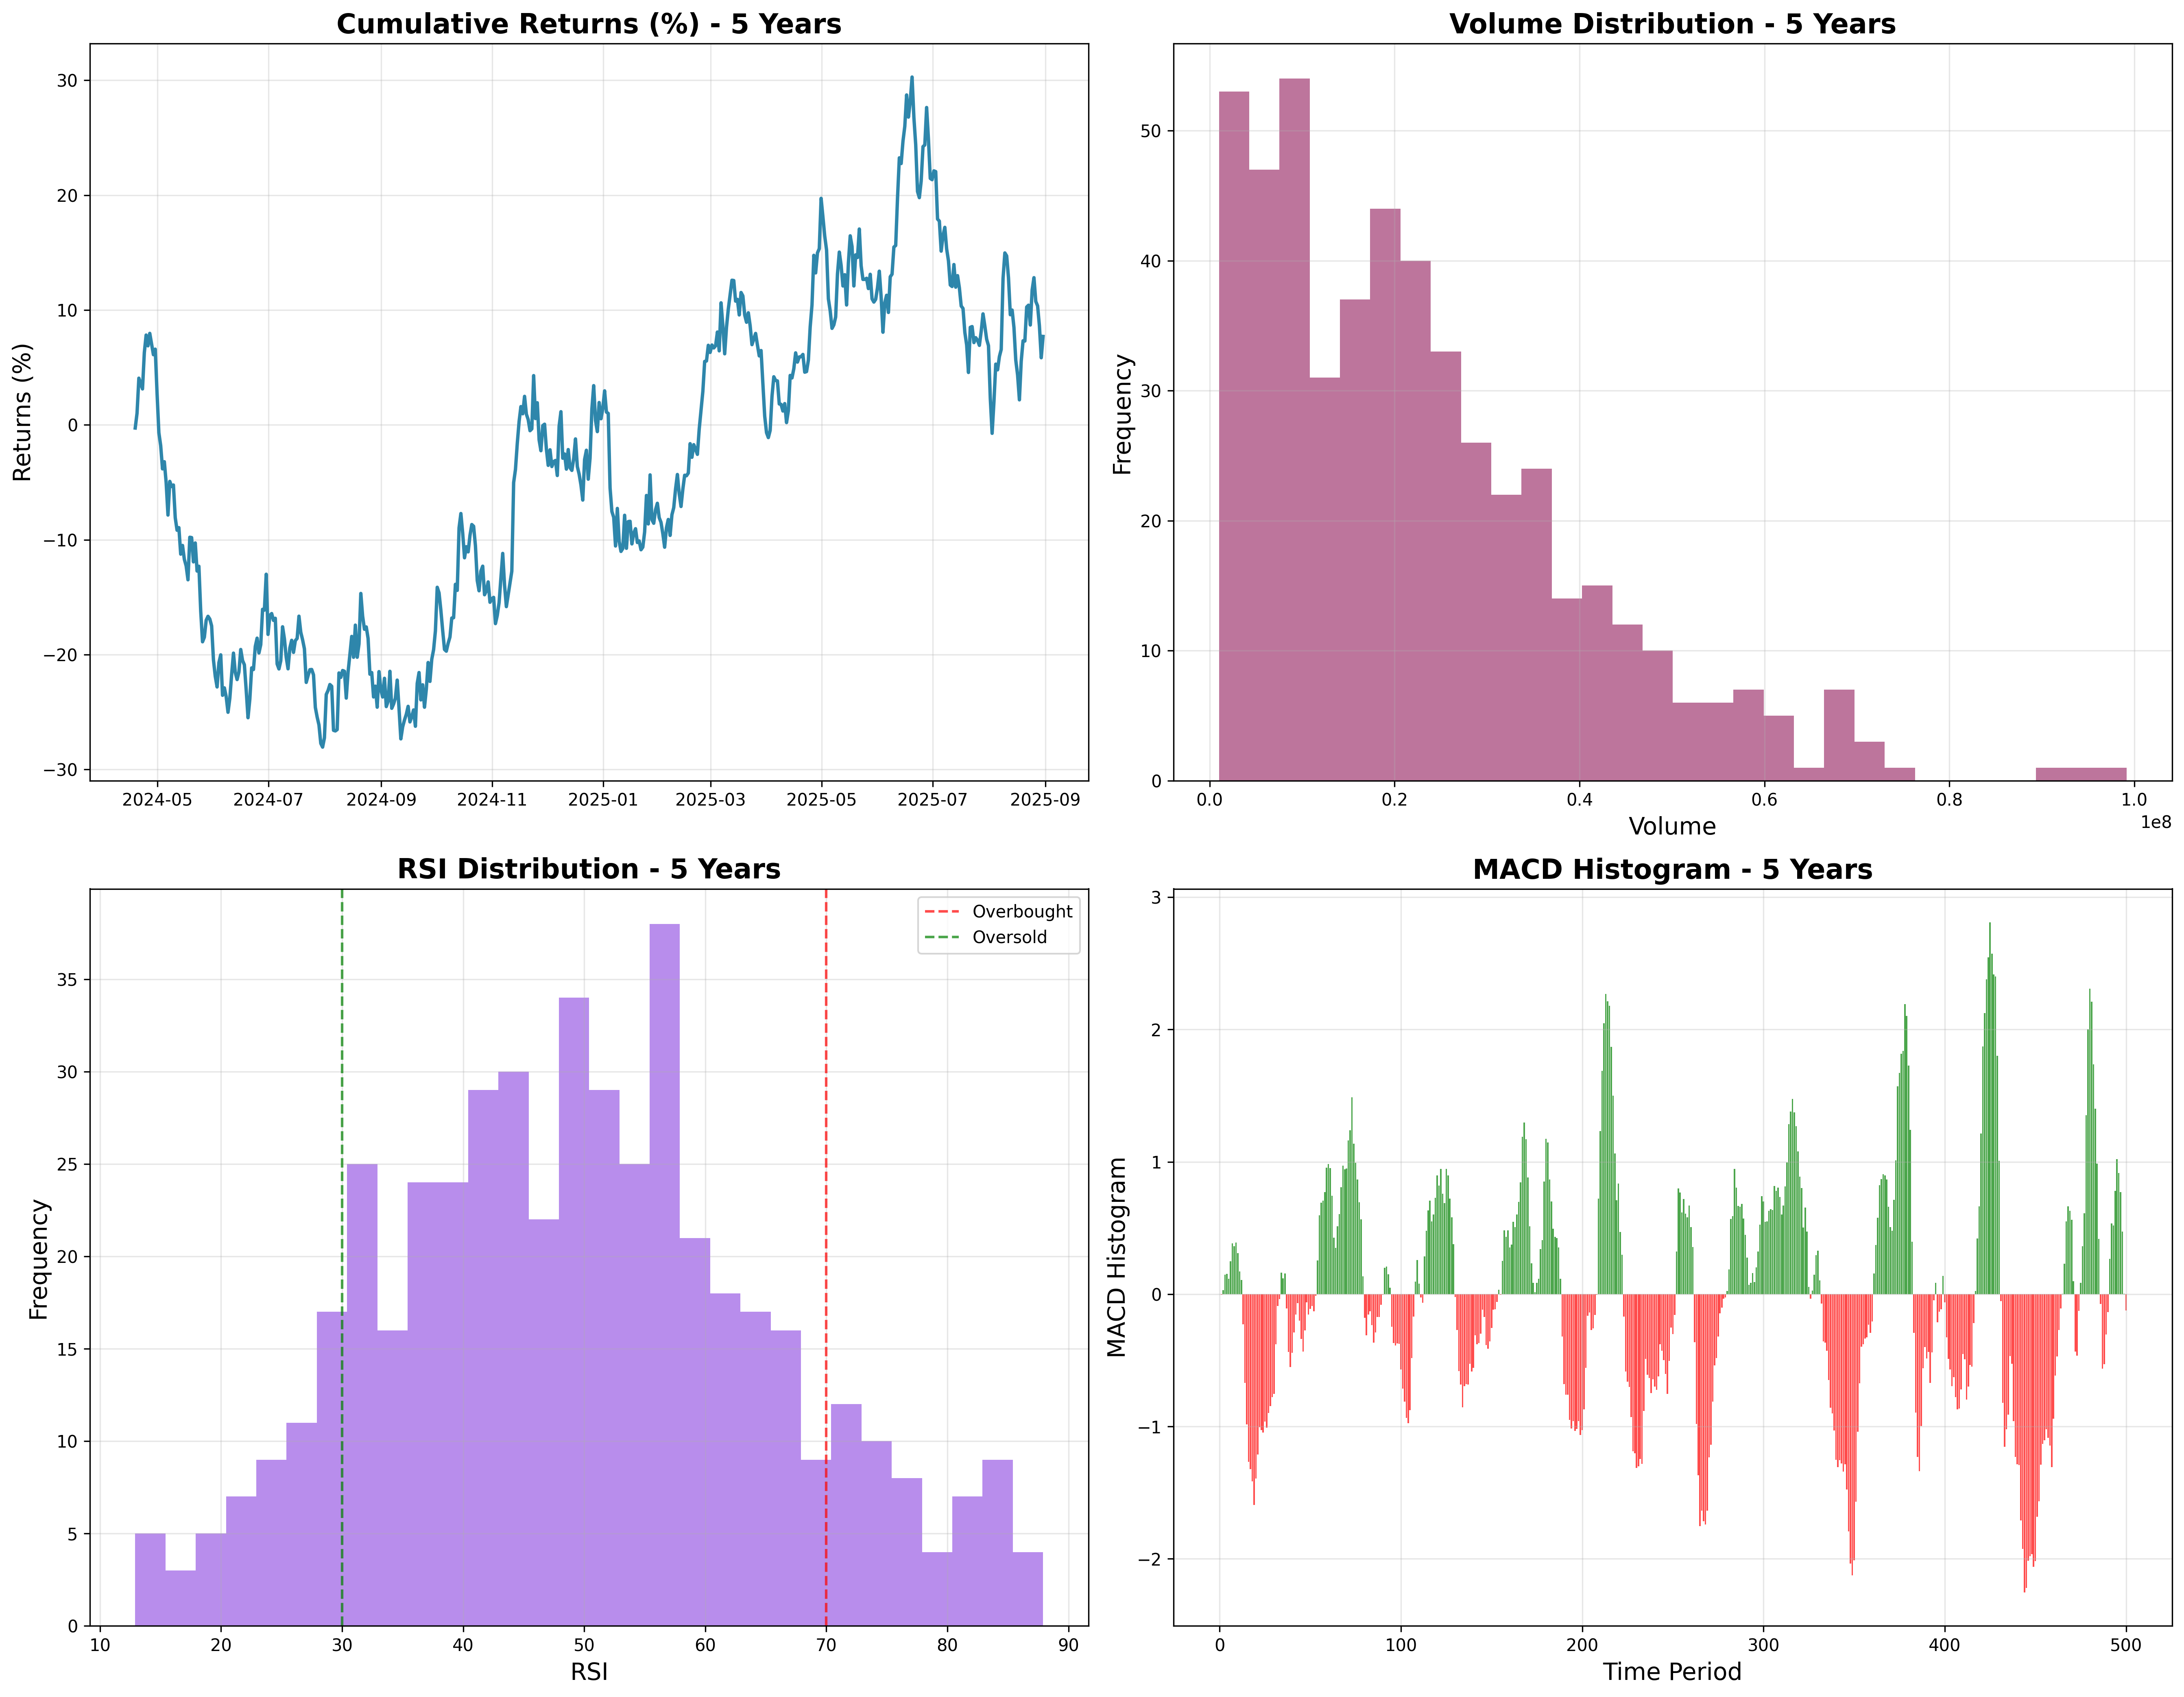
- Enhanced Performance Metrics: 5-year returns, volatility analysis, and statistical distributions
📈 5-Year Price and Volume Analysis
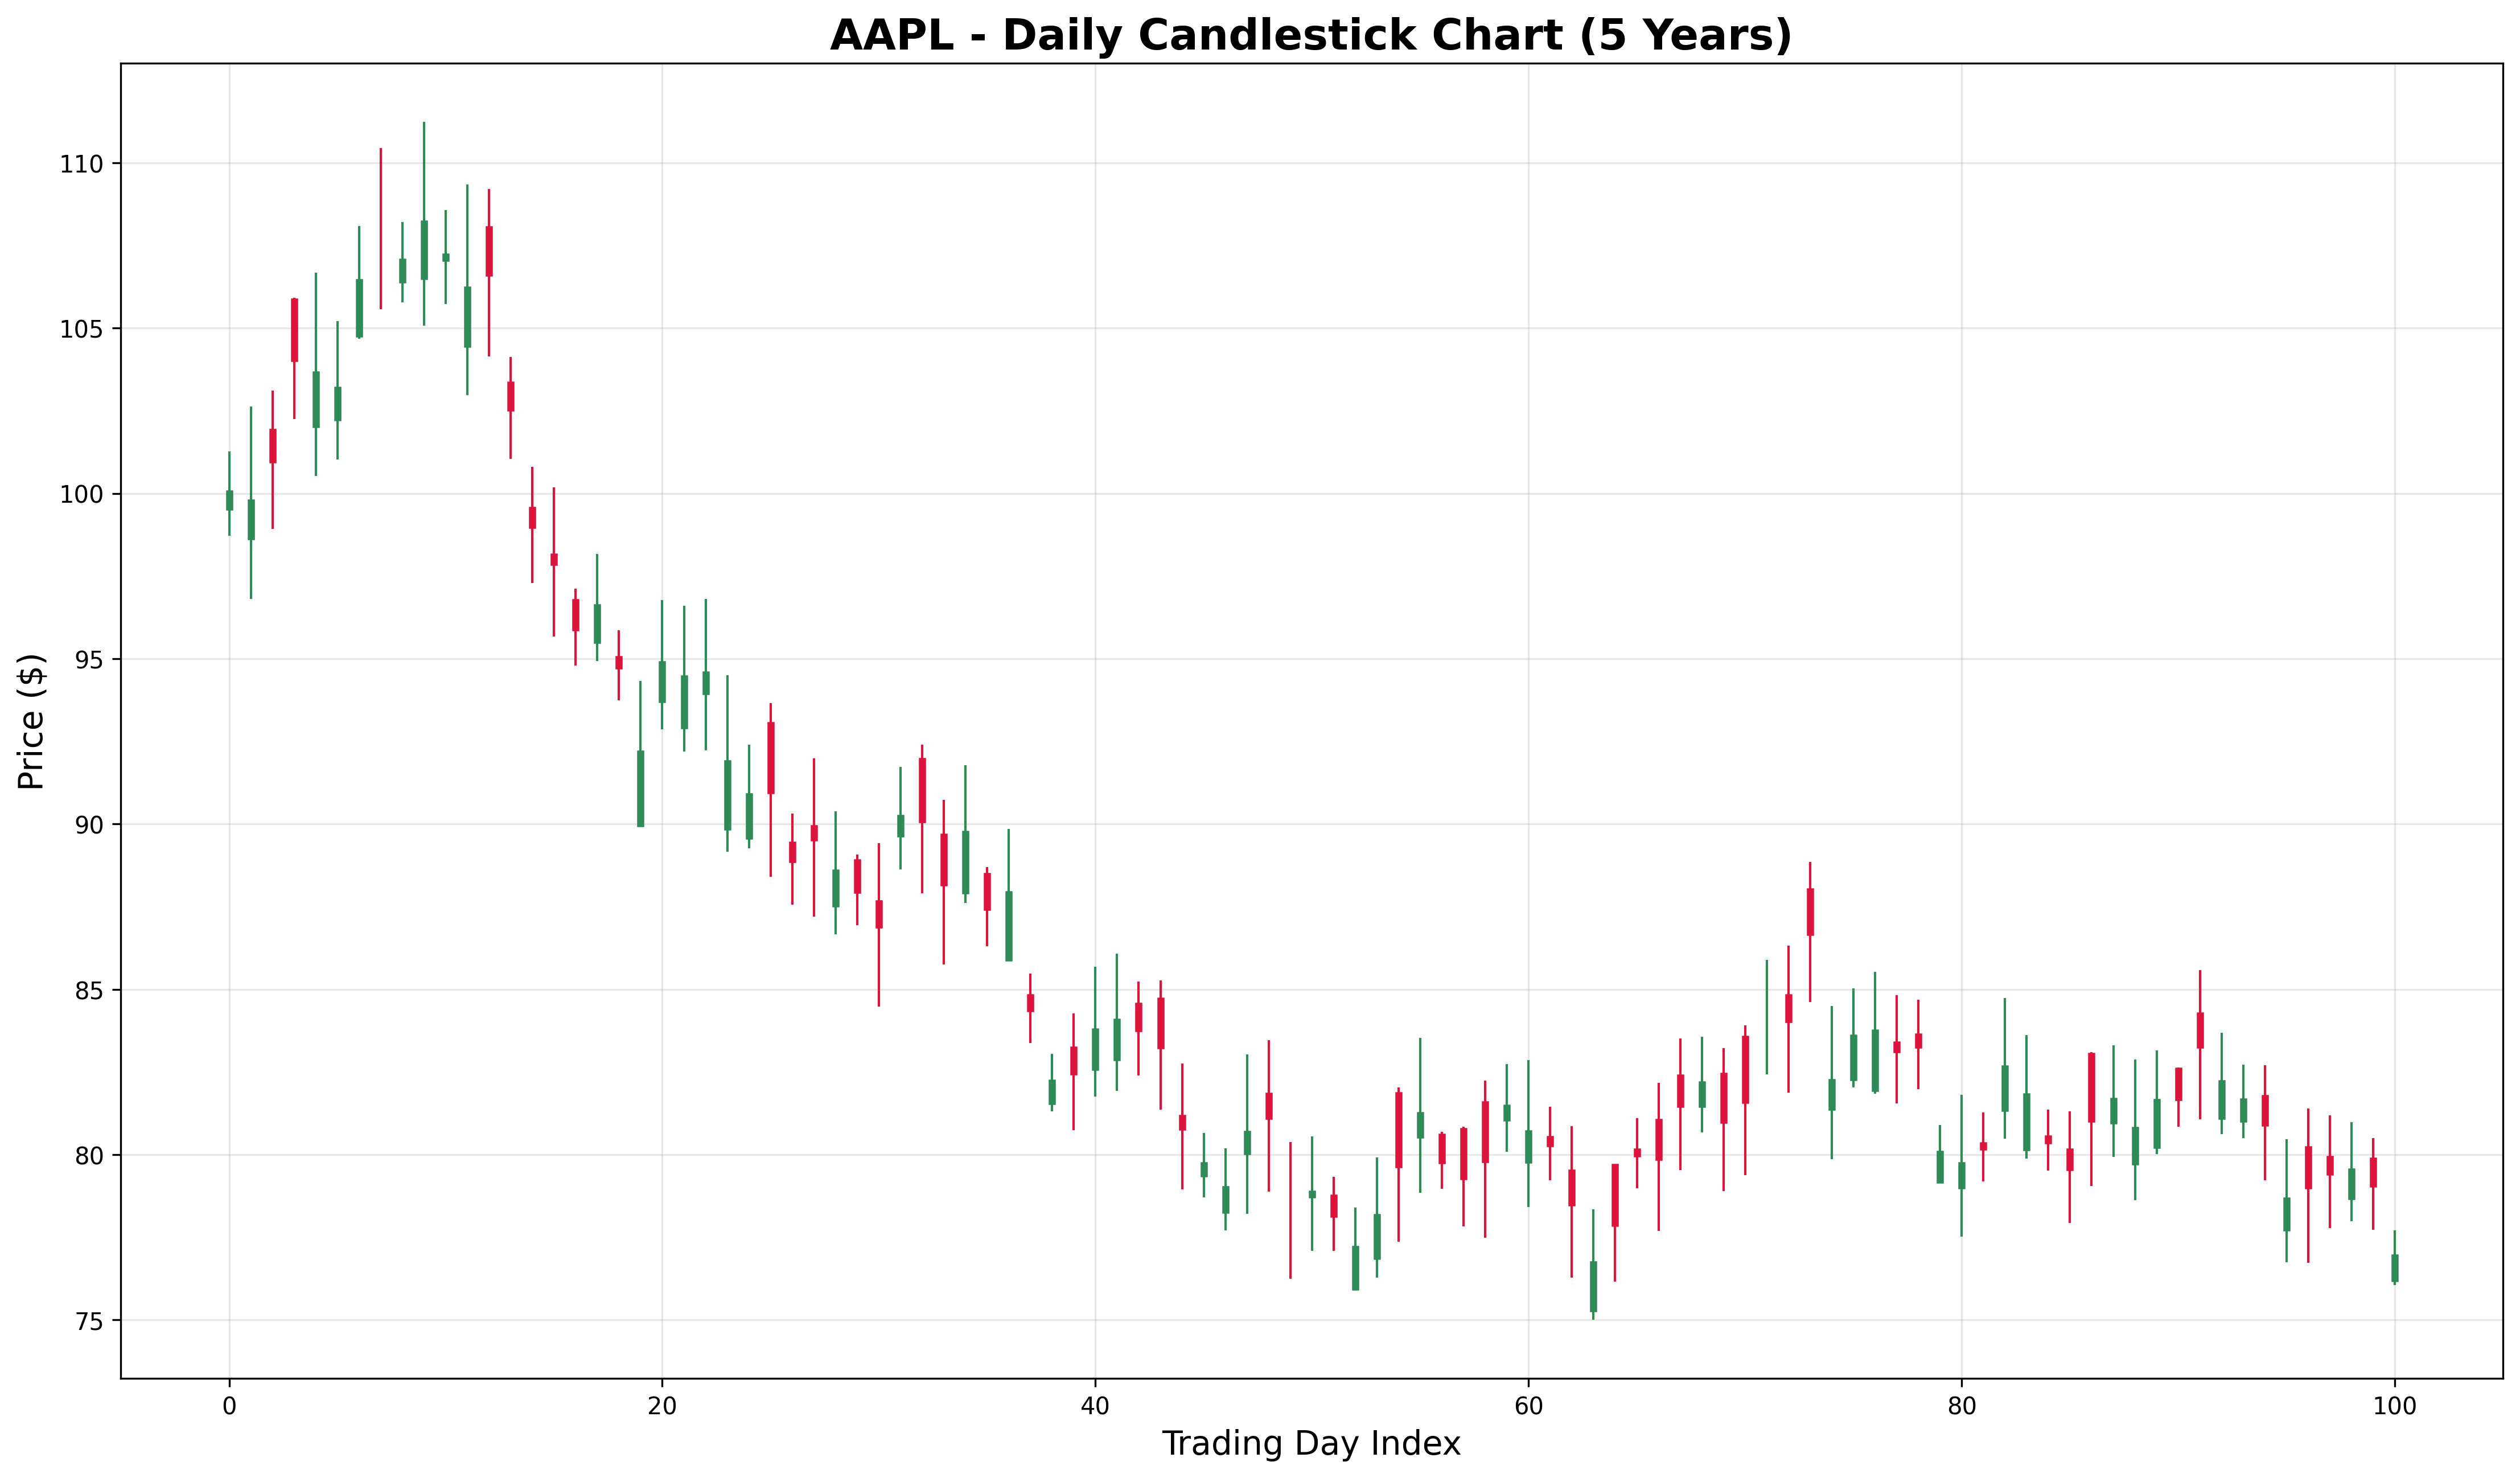
🕯️ 5-Year Candlestick Chart
🔧 5-Year Technical Analysis Dashboard
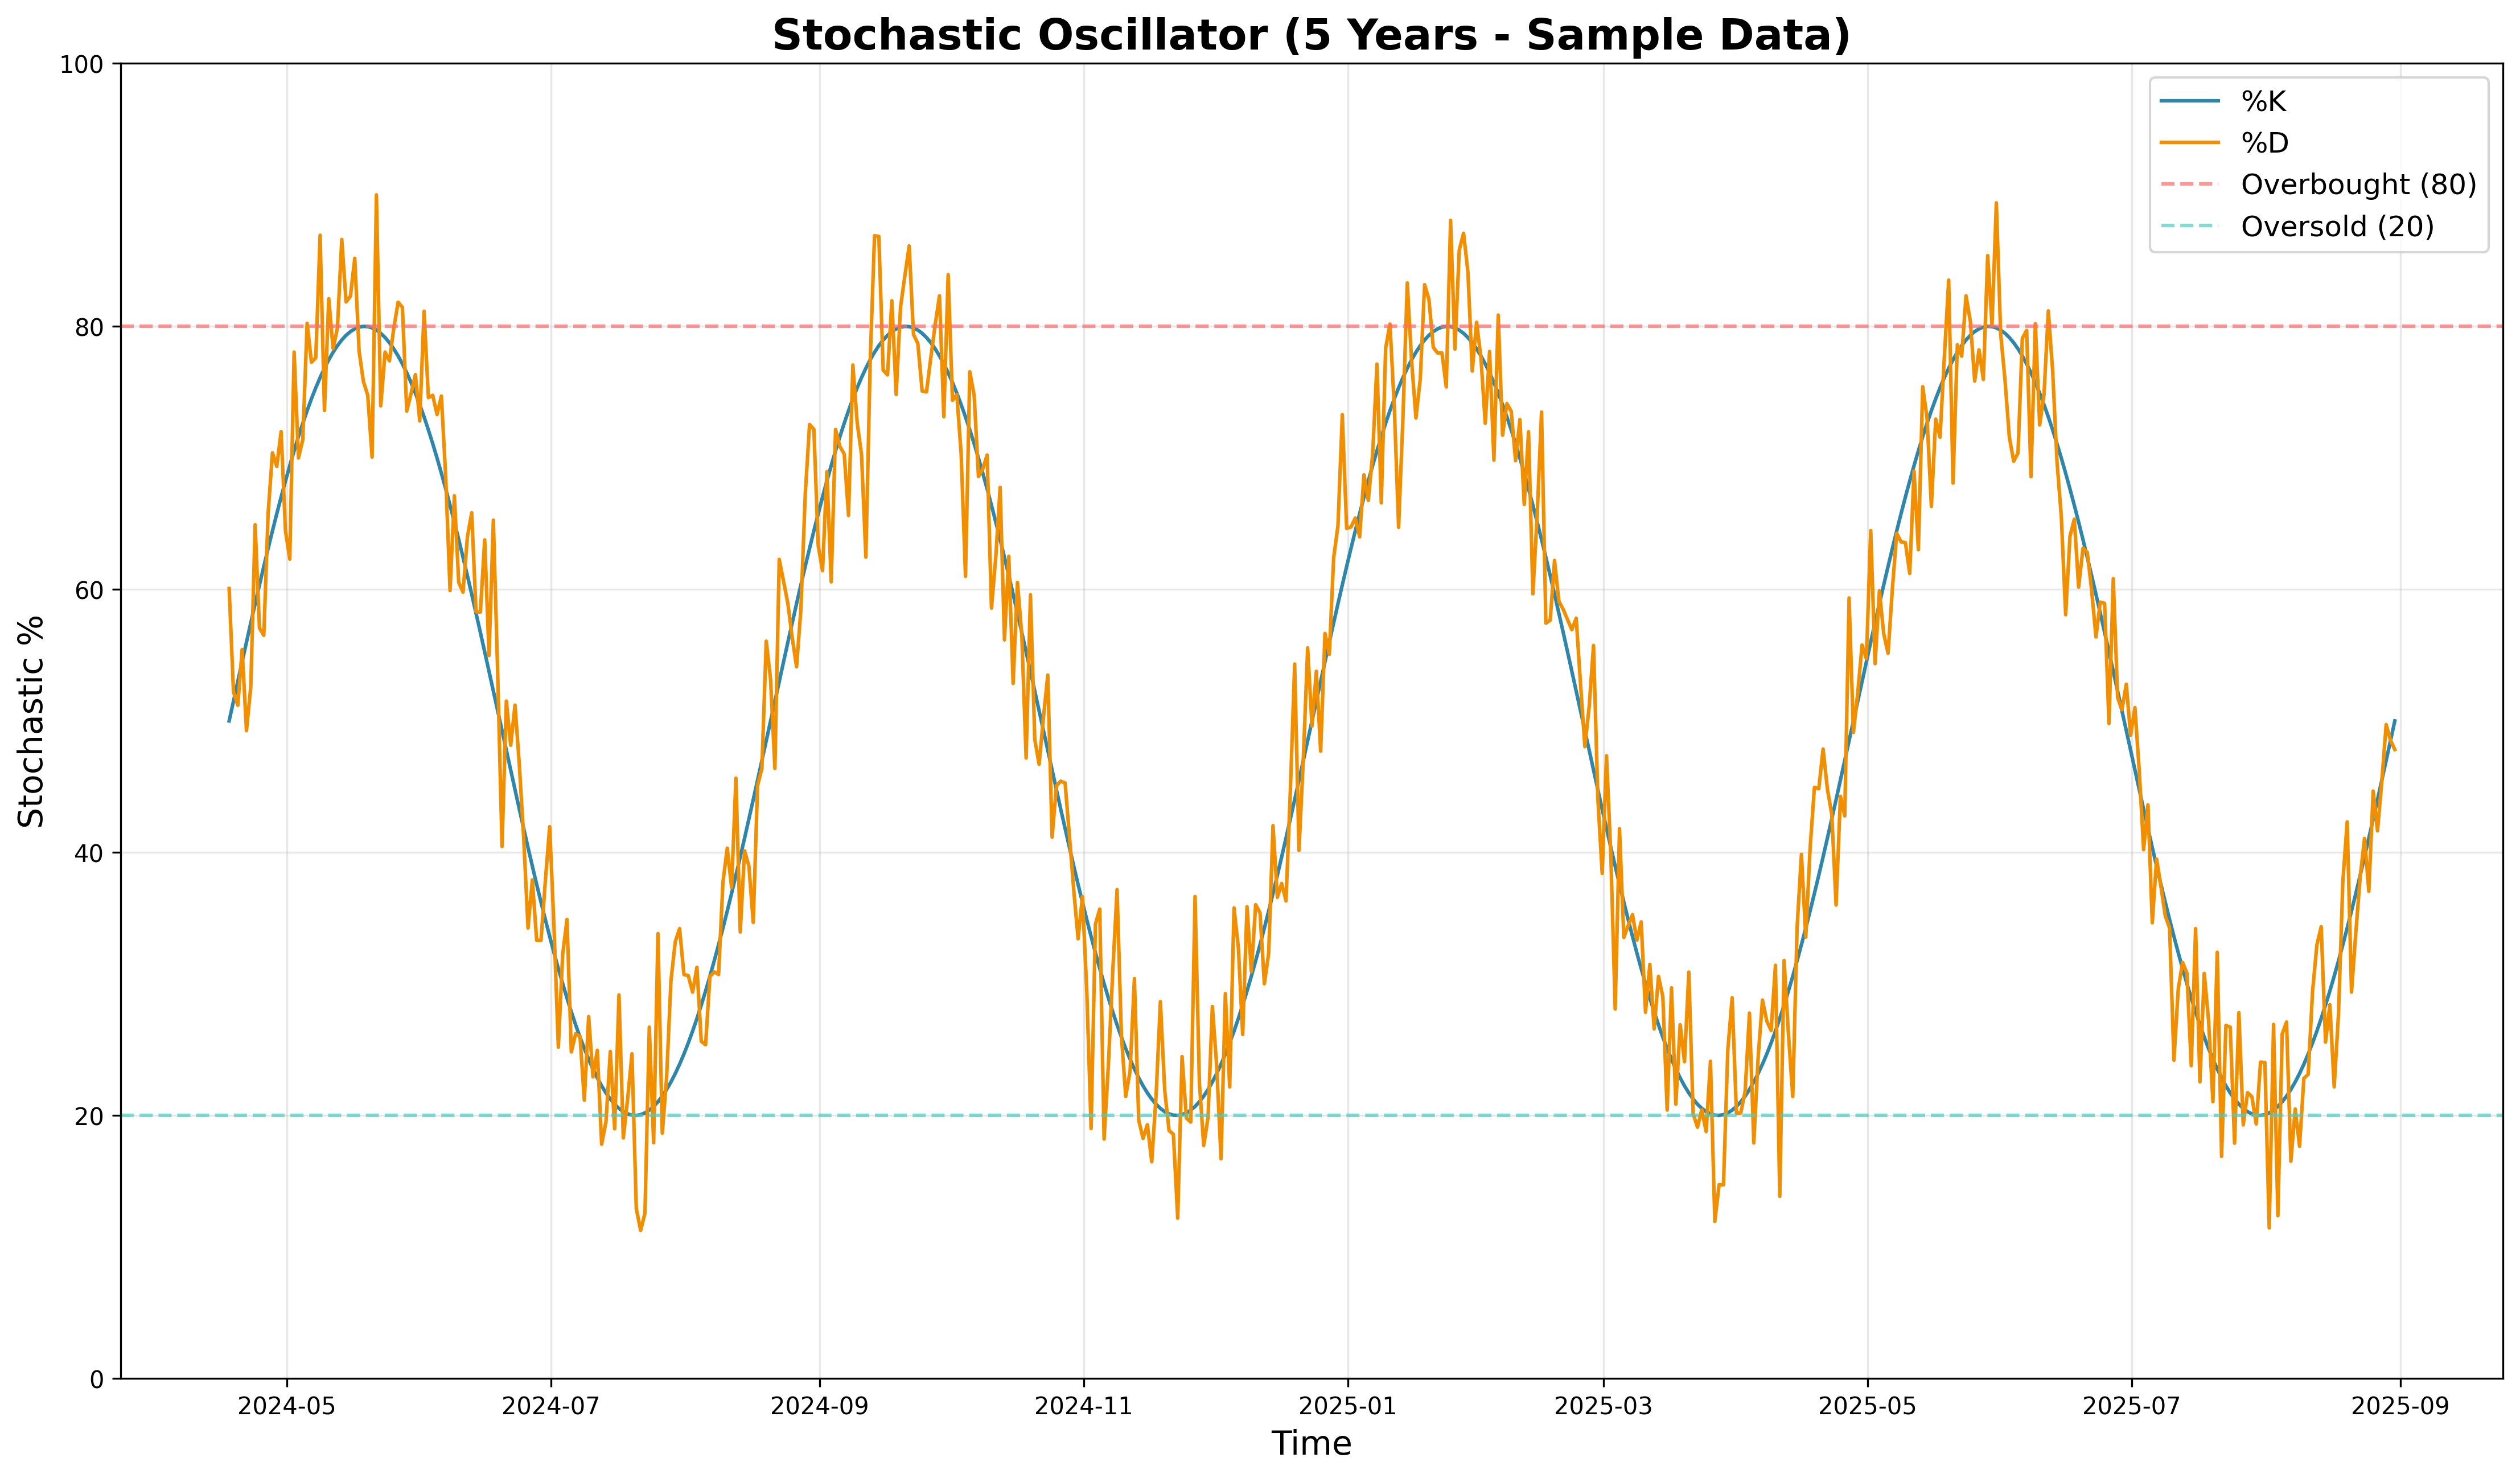
📊 5-Year Stochastic Oscillator
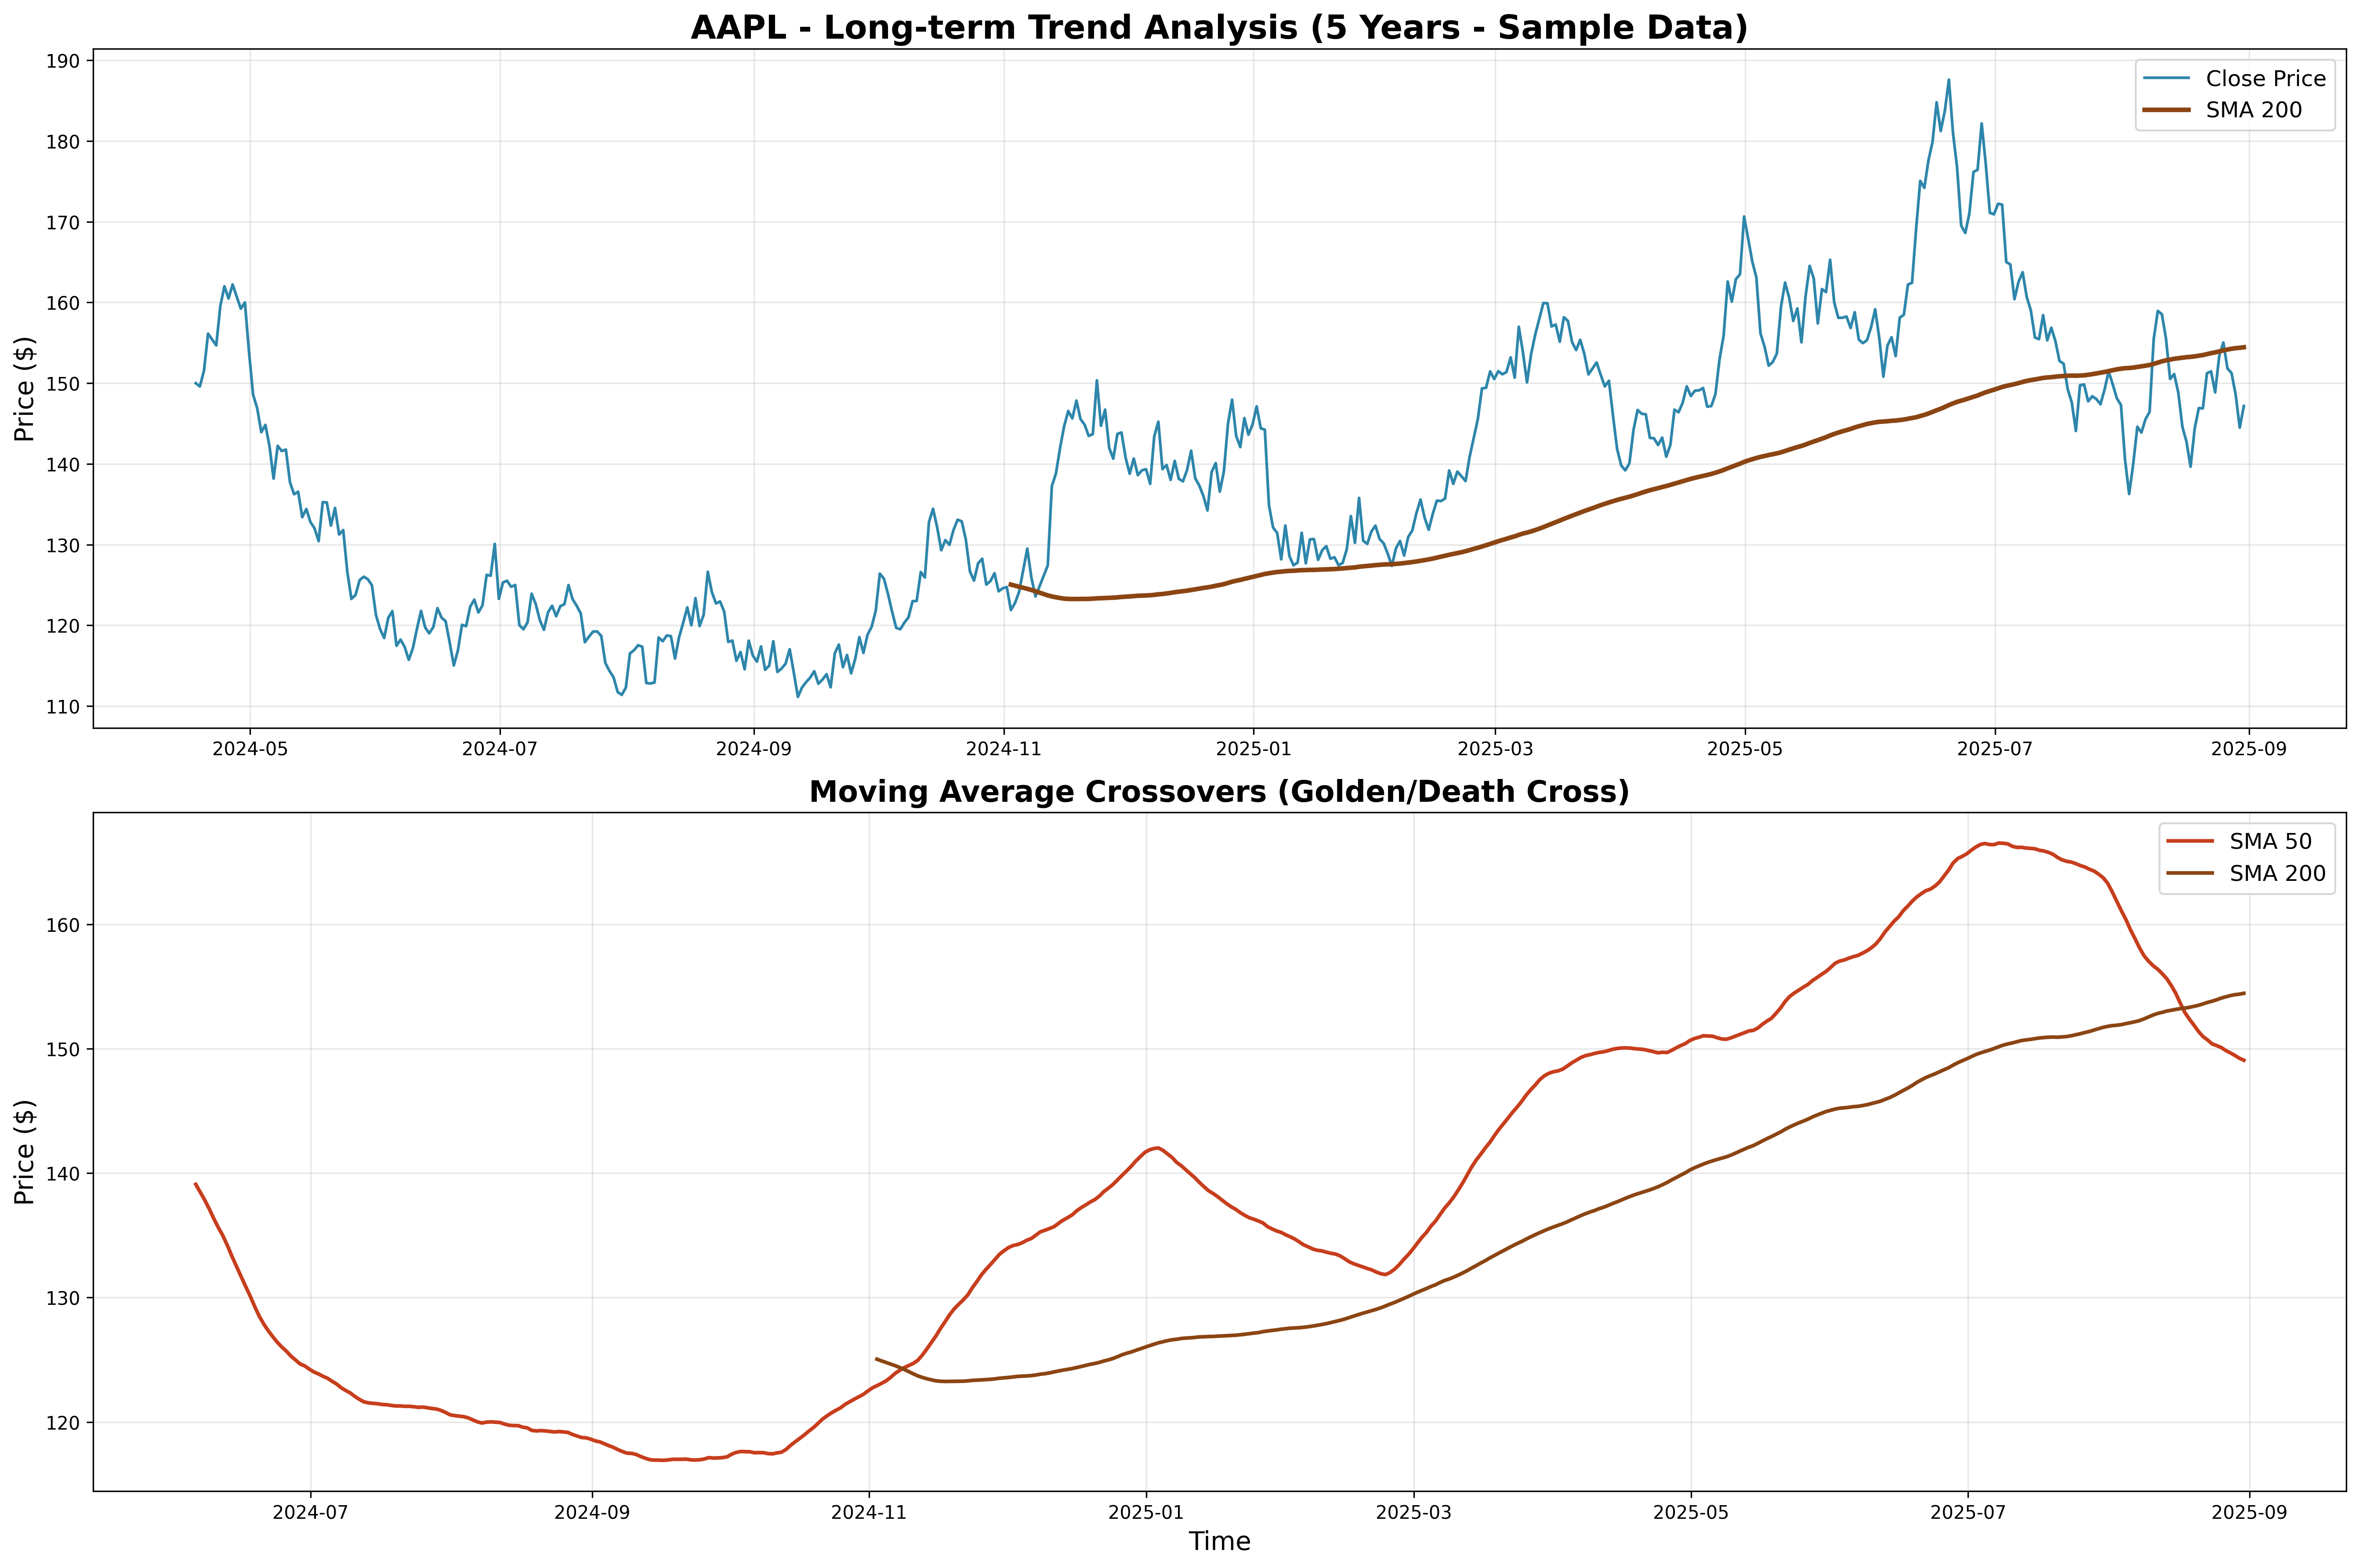
🎯 Long-term Trend Analysis & Golden/Death Cross
📋 5-Year Summary Dashboard
📈 200-Day SMA
The 200-day Simple Moving Average is the gold standard for long-term trend analysis. When price is above the 200-day SMA, it's generally considered a bull market. When below, it's a bear market.
🔄 Golden Cross
A Golden Cross occurs when the 50-day SMA crosses above the 200-day SMA. This is a major bullish signal that often precedes significant upward moves and is widely followed by institutional investors.
📉 Death Cross
A Death Cross happens when the 50-day SMA crosses below the 200-day SMA. This is a major bearish signal that often precedes significant downward moves and can indicate the start of a bear market.
📊 Market Cycles
5-year analysis reveals complete market cycles including bull markets, bear markets, and consolidation periods. This helps traders understand where we are in the current cycle and what to expect next.
🚀 Enhanced Features for 5-Year Analysis
- Extended Moving Averages: Added 200-day SMA and 50-day EMA for long-term trend analysis
- Golden/Death Cross Detection: Automatic identification of major trend reversal signals
- Long-term Trend Visualization: Clear visualization of bull/bear market periods
- Enhanced Statistical Analysis: 5-year distributions and performance metrics
- Market Cycle Identification: Tools to identify major market phases
- Professional Chart Sizing: Larger charts optimized for extended timeframes